Rent-to-Price Ratio: How Investors Use It on Zillow
Rent-to-price ratio (and rent per square foot) explained: how Realy calculates it on Zillow listings and how investors use it to spot cash-flow opportunities fast.
Before you run a full underwriting model, smart investors apply a 30-second screen: Does rent justify the price? Rent-to-price ratio is one of the fastest ways to answer that on Zillow.
What Is Rent-to-Price Ratio?
The simplest form:
Rent-to-Price Ratio = Annual Rent ÷ Purchase Price
Or as a monthly metric (often called the 1% rule variant):
Monthly Rent ÷ Purchase Price ≥ 1% → classic "1% rule" screen
Example: $1,500/mo rent on a $150,000 purchase → 1.0% monthly ratio (borderline by the old rule). $1,800 on $150K → 1.2% (stronger screen pass).
The 1% rule is a heuristic, not a law. Taxes, insurance, and rates kill deals that pass 1%, and some great deals fail it in appreciating markets.
How Realy Calculates Related Metrics
Realy's engine computes:
rentPerFoot = Gross Monthly Income ÷ Living Area (sqft)
salePricePerFoot = Purchase Price ÷ Living Area
rentPerPrice = Rent Zestimate ÷ Price  (in property list data)
On analyzed listings you'll see rent per foot alongside cap rate and cash-on-cash, useful when comparing condos vs. SFRs in the same zip.
Annual rent-to-price in percentage terms:
Annual Rent-to-Price = (Monthly Rent × 12) ÷ Purchase Price
A 8% annual ratio ≈ 0.67% monthly, below the 1% rule but may still cash-flow in low-tax markets with strong financing.
How Investors Use It on Zillow
1. Quick filter before deep analysis
Scan a Zillow search in Realy's table view. Sort or filter mentally by rent/price or rent/sqft. Only open side panels on listings that clear your floor.
2. Cross-market comparison
| Market | Typical annual rent/price |
|---|---|
| San Francisco | 3–5% |
| Dallas (many zips) | 8–15%+ |
| Cleveland / Indianapolis | 10–14%+ |
A 6% ratio in Dallas may be weak; the same ratio in Denver might be excellent.
3. Spot mispriced listings
If rent/sqft is high vs. neighbors but price/sqft is low, you may have found a motivated seller or a data error, worth verifying.
4. Condo vs. SFR sanity check
Compare rentPerFoot across property types in the same building or block. Outliers often flag HOA special assessments or condition issues.
Worked Example from Real Data
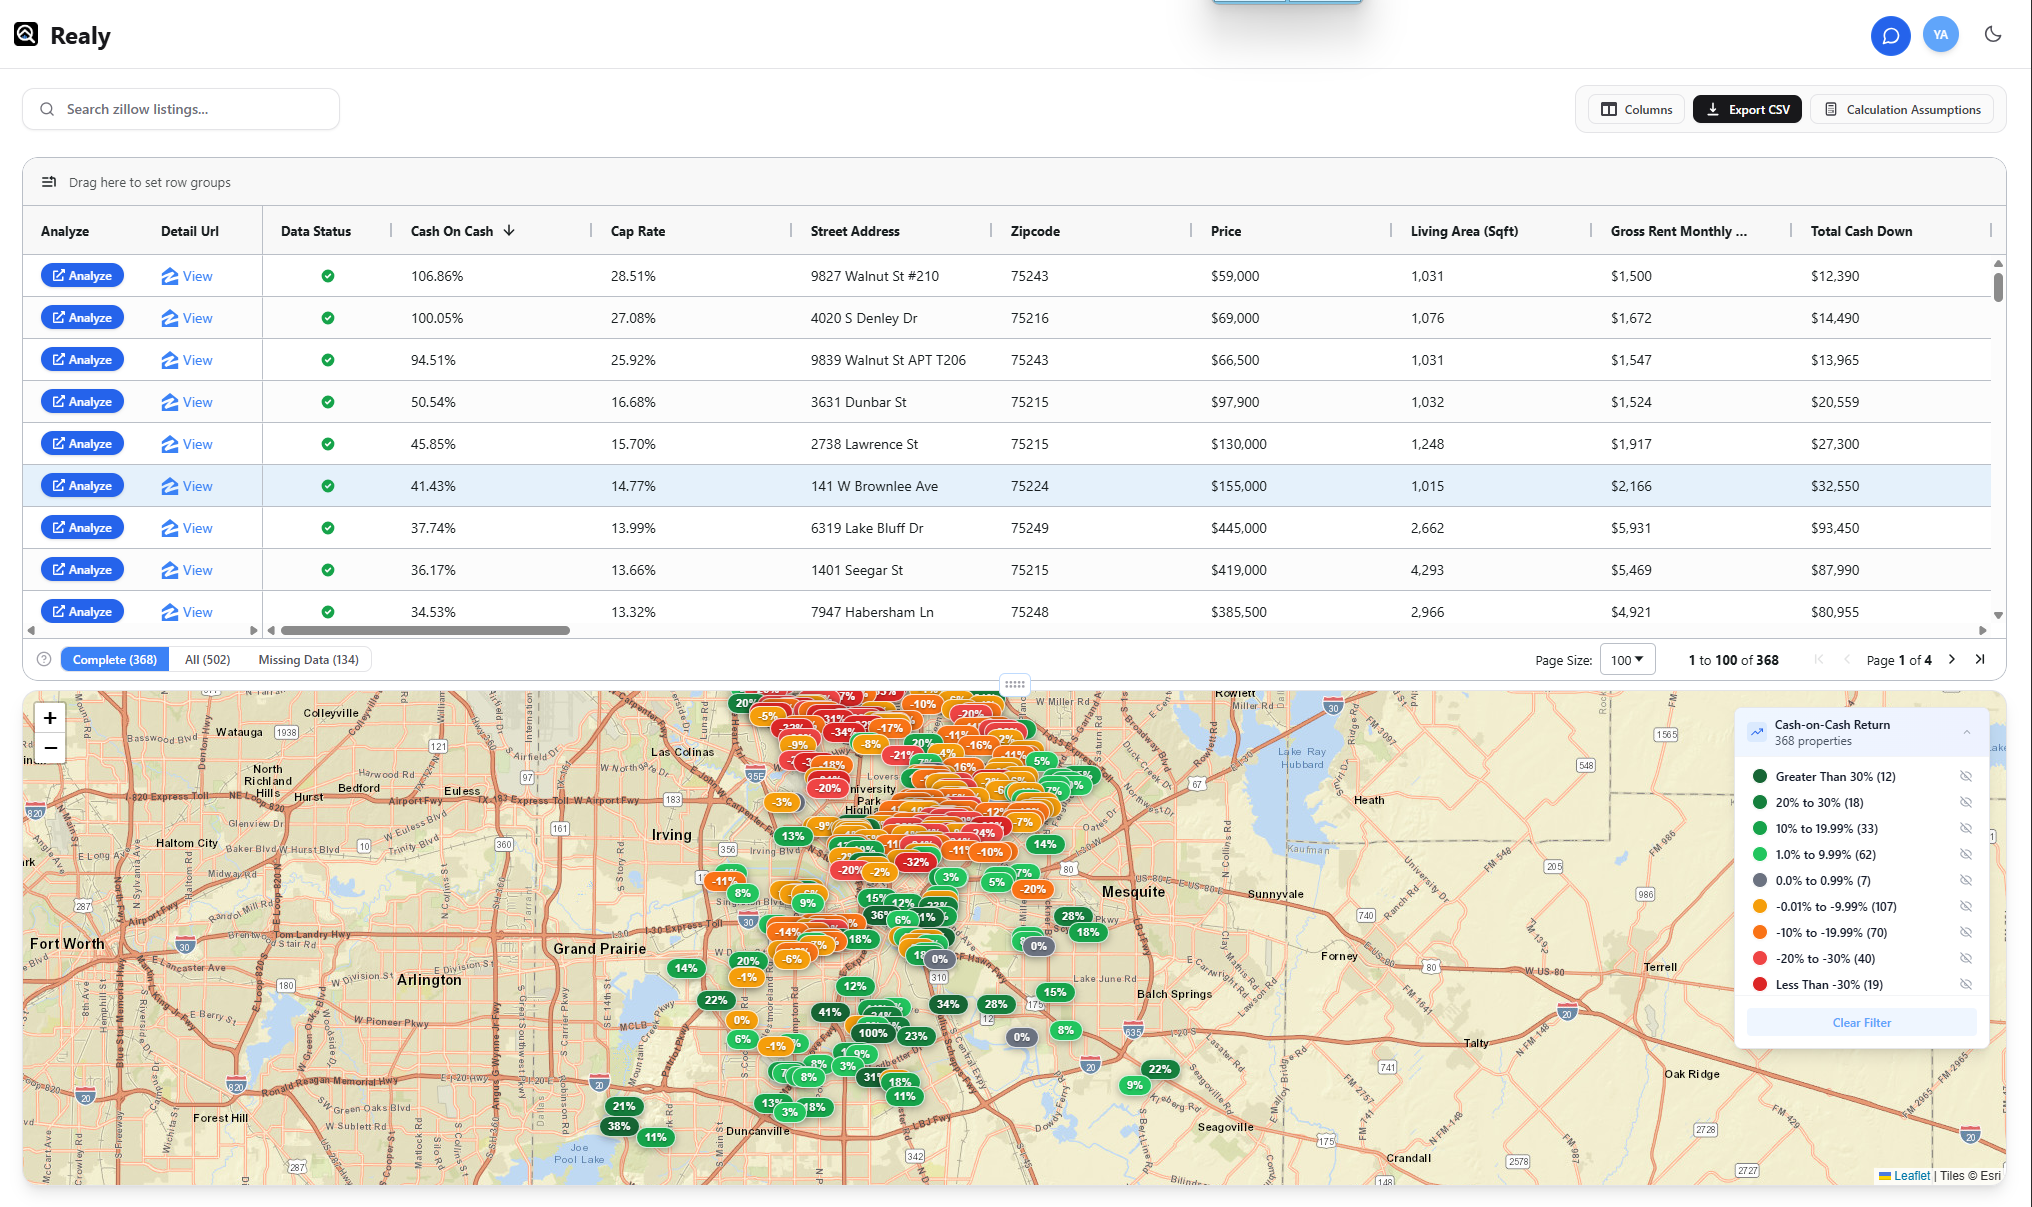
From a Dallas-area listing (9827 Walnut St #210):
| Metric | Value |
|---|---|
| Price | $59,000 |
| Rent | $1,500/mo |
| Monthly rent/price | 2.54% |
| Annual rent/price | 30.5% |
| Rent/sqft | $1.45 |
That ratio screams "run full underwriting", but also "why is it so cheap?" (See red flags guide).
Limitations
Rent-to-price ignores:
- Property taxes (Texas vs. Indiana matters enormously)
- Insurance and HOA
- Condition / capex
- Financing terms
- Actual achievable rent vs. Rent Zestimate
Always graduate from ratio screening to full NOI and CoC analysis.
Run Rent-to-Price on a Whole Zillow Search
- Open Zillow search results.
- Click Open Realy Analyzer (floating button).
- Compare rent/sqft and cash metrics across every listing in one table/map.
- Shortlist winners and export to Google Sheets for your pipeline.
Full bulk workflow (no spreadsheet required for screening): Analyze many Zillow listings without a spreadsheet.