Top 10 Zillow Investment Listings: How Realy Ranks Deals Instantly
Learn what separates a great Zillow rental listing from a money pit—and how cap rate, cash-on-cash return, and cash flow are calculated on every property you browse.
Browsing Zillow for investment properties is easy. Knowing which listings are actually worth your time is the hard part.
Most investors scroll photos, glance at price, and guess. That approach leads to wasted showings, bad offers, and deals that look good until you run the numbers in a spreadsheet three days later.
Realy was built to fix that gap: investment metrics on every Zillow listing, in seconds, while you browse. This guide breaks down what a "top 10" rental listing really means—and exactly how those numbers are calculated.
What "Top 10" Means for Investors (Not Zillow's Sort Order)
Zillow's default sort is not built for investors. Price cuts, new listings, and "recommended" homes optimize for buyers—not for cash flow, cap rate, or return on invested cash.
A top investment listing typically checks most of these boxes:
| Rank signal | What it tells you |
|---|---|
| Strong cash-on-cash return | Annual cash flow vs. cash you put in |
| Healthy cap rate | NOI relative to purchase price |
| Positive monthly cash flow | Rent covers expenses with margin |
| Realistic rent assumptions | Based on comps, not wishful thinking |
| Manageable expenses | Taxes, insurance, HOA, maintenance modeled |
| Conservative financing | Down payment, rate, and term you can actually get |
| Value-add potential | Room to force appreciation or raise rents |
| Market liquidity | Can you exit if the thesis breaks? |
| Low surprise costs | Age, roof, HVAC, and capex risk considered |
| Fits your strategy | BRRRR, long-term hold, or turnkey—aligned |
Realy scores listings against metrics like these so you can filter emotionally—and invest logically.
The 10 Metrics Realy Surfaces on Zillow Listings
When you open a property on Zillow with the Realy extension, you see a deal snapshot designed for rental investors. Here are the core metrics and how each one is calculated.
1. Gross Monthly Rent
Estimated rent based on listing data, local comps, and your assumptions. You can adjust rent in Realy when you know the market better than the default model.
Why it matters: Every downstream metric—NOI, cash flow, cap rate—starts with credible rent.
2. Gross Annual Rent
Gross Annual Rent = Monthly Rent × 12
3. Operating Expenses
Typical line items include property taxes, insurance, HOA fees, property management, maintenance reserves, and utilities (if owner-paid).
Annual Operating Expenses = Sum of all recurring costs
4. Net Operating Income (NOI)
NOI is what the property earns before debt service.
NOI = Gross Annual Rent − Operating Expenses
Example: $2,200/mo rent → $26,400/year. Expenses $9,800/year → NOI = $16,600.
5. Cap Rate
Cap rate shows return if you bought all-cash (no mortgage).
Cap Rate = NOI ÷ Purchase Price
Example: NOI $16,600 on a $285,000 purchase → 5.8% cap rate.
Investors often target 5–8%+ depending on market and risk—but context matters. A 4% cap in a high-appreciation market may still work for your strategy.
6. Monthly Mortgage Payment
Based on loan amount, interest rate, and amortization term.
Loan Amount = Purchase Price − Down Payment
Realy models principal and interest so you see true carry cost—not just "estimated payment" from a generic calculator.
7. Monthly Cash Flow
Monthly Cash Flow = Monthly Rent − Monthly Expenses − Mortgage Payment
Positive cash flow means the property pays you each month after debt service. Negative cash flow can still work for appreciation-heavy strategies—but you need to know you're subsidizing the asset.
8. Annual Cash Flow
Annual Cash Flow = Monthly Cash Flow × 12
9. Cash Invested
Total cash required to close and operate early on:
- Down payment
- Closing costs
- Initial repairs (if modeled)
- Reserves (optional)
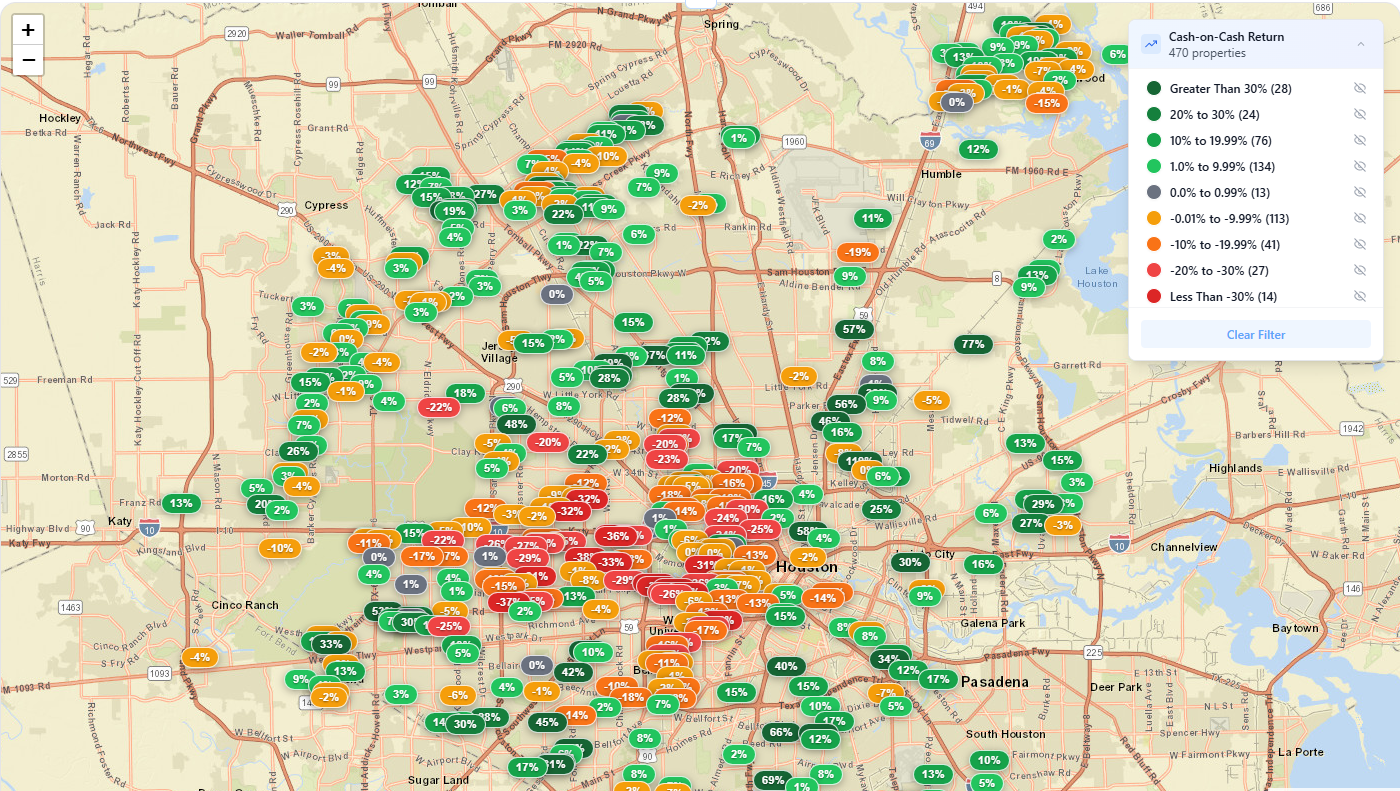
10. Cash-on-Cash Return
The metric most rental investors watch daily:
Cash-on-Cash Return = Annual Cash Flow ÷ Cash Invested
Example: $4,200 annual cash flow on $52,000 cash invested → 8.1% CoC.
A listing in the "top 10" for your portfolio usually combines a CoC that beats your hurdle rate with acceptable cap rate and manageable risk.
How Realy Builds a "Top Listing" Score in Practice
Realy does not replace your judgment—it accelerates it. On each Zillow page you can:
- See metrics instantly without exporting to Excel.
- Tweak assumptions (rent, down payment, rate, expenses).
- Compare deals across markets in one session.
- Skip listings that fail your minimum CoC or cash flow rules.
- Shortlist winners for deeper due diligence.
That workflow is how investors find their personal top 10: not ten random Zillow homes, but ten that survive real underwriting.
Sample Ranking: What Separates #1 from #10
Imagine two listings in the same ZIP code:
| Listing | Price | Rent | Cap Rate | CoC | Monthly CF |
|---|---|---|---|---|---|
| Listing A | $240k | $1,950 | 6.4% | 9.2% | +$312 |
| Listing B | $315k | $2,100 | 4.1% | 3.8% | +$48 |
Listing A ranks higher for cash-flow investors. Listing B might still work for appreciation or value-add—but only if you model renovation costs and post-repair rent.
Realy makes that comparison visible before you book a showing.
Red Flags That Knock a Listing Out of the Top 10
Even beautiful homes fail investor screens:
- Rent estimates far above comp averages
- HOA + insurance + taxes consuming 45%+ of rent
- Negative cash flow at realistic financing terms
- Cap rate below your market floor with no upside story
- Deferred maintenance not reflected in your expense model
Run these checks on every "maybe" listing. The best investors say no quickly and yes rarely.
Using Realy to Build Your Shortlist Today
- Install the Realy Chrome extension.
- Open Zillow and filter to your target market and price range.
- Open listings in tabs—metrics appear on each property page.
- Set your minimum cash-on-cash and cash flow thresholds.
- Save only deals that clear your rules for underwriting.
Your top 10 list should be dynamic: new inventory hits Zillow daily, and assumptions change with rates and rents. Realy keeps the math live so your shortlist stays honest.
Final Thoughts
The best Zillow investment listings are not the ones with the best photos—they are the ones that survive real numbers: NOI, cap rate, cash flow, and cash-on-cash return.
Realy puts those calculations where you already search, so you spend less time in spreadsheets and more time closing deals that actually work.
Ready to rank your next ten listings? Add Realy to Chrome and run the numbers on your next Zillow browse session.