Realy vs Spreadsheet: Zillow Deal Analysis Workflow
Copy-paste Zillow into Excel vs. instant metrics with Realy: side-by-side workflow comparison, time savings, and when each approach still makes sense.
Every rental investor knows the spreadsheet ritual: open Zillow, copy address, price, beds, tax, rent guess, paste into Excel, rebuild the formulas, repeat forty times, realize it's midnight.
Realy exists because that workflow does not scale. Here's an honest comparison.
The Spreadsheet Workflow
Typical steps:
- Filter Zillow by price, beds, property type
- Open listing → manually copy fields
- Paste into Excel/Google Sheets template
- Enter assumptions (down payment, rate, expenses)
- Calculate NOI, cap rate, CoC by hand or formula
- Repeat for each candidate
- Re-enter when assumptions change
Pros:
- Unlimited customization
- LP-ready reporting formats
- Familiar if you're an Excel power user
Cons:
- 5–15 minutes per property minimum
- Copy errors (wrong sqft, stale price)
- No map/table view of entire search
- Assumption changes require re-pasting or bulk edits
- Analysis is stale the moment Zillow updates
The Realy Workflow
Typical steps:
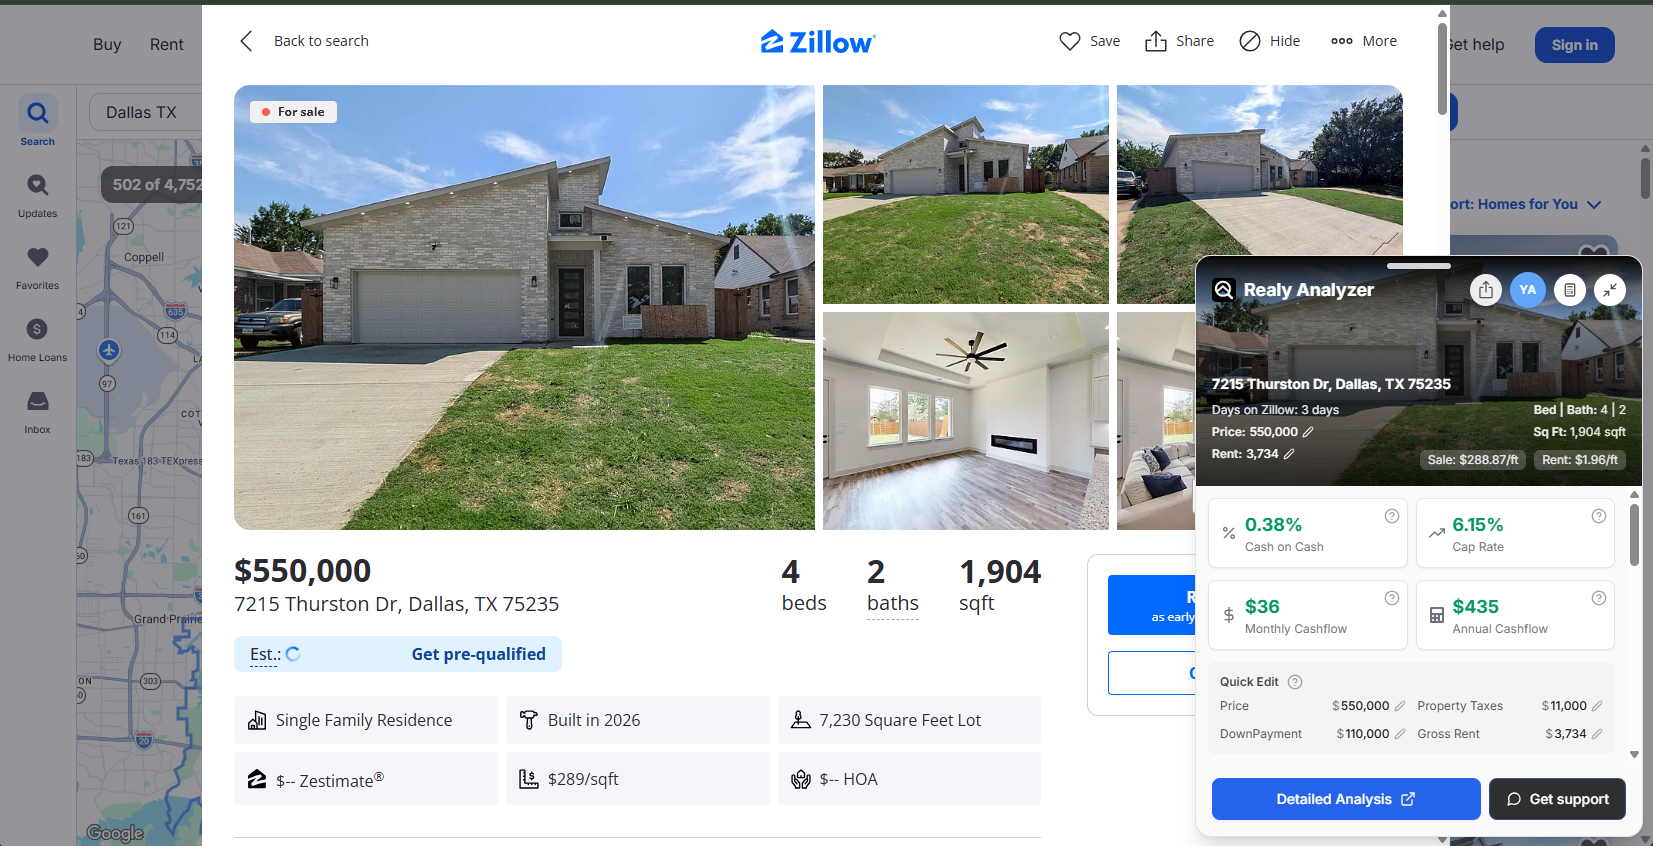
- Filter Zillow → click Open Realy Analyzer
- See cap rate, CoC, cash flow on every listing in table + map
- Adjust assumptions once (20% down, 6.5%, 2% tax, etc.)
- Click outliers → side panel for full detail
- Open Detailed analysis on Realy.app for finalists
- Share report or continue editing with synced assumptions
Pros:
- Seconds per listing, not minutes
- Same calculation engine every time (NOI → CoC pipeline)
- Sort/rank entire markets by CoC
- Assumption changes propagate instantly
- No tab switching or paste errors
Cons:
- Less arbitrary custom columns than a blank spreadsheet
- Zillow-only today (Redfin/Realtor on roadmap)
Time Comparison (Realistic)
| Task | Spreadsheet | Realy |
|---|---|---|
| Screen 50 listings | 4–8 hours | 5–15 minutes |
| Update rate assumption globally | 30–60 min | Instant |
| Compare 3 finalists side-by-side | Manual tabs | Table sort + side panels |
| Share analysis with partner | Export PDF/email sheet | Shareable Realy report |
If you analyze even 10 listings per week, Realy saves hours monthly, hours better spent on showings and offers.
Do the Numbers Match?
Realy's formulas:
NOI = Effective Gross Income − Operating Expenses
Cap Rate = NOI ÷ Purchase Price
Cash Flow = NOI − Annual Mortgage
CoC = Cash Flow ÷ Total Cash Down
A well-built spreadsheet using the same inputs should match Realy within rounding. Differences usually come from:
- Rent source (your guess vs. Rent Zestimate)
- Tax calculation method (% vs. actual bill)
- Mortgage amortization implementation
- Missing vacancy or management in one model
When to Still Use a Spreadsheet
- LP syndication models with waterfall tiers
- Multi-year pro formas with rent escalation schedules
- Portfolio aggregation across asset classes Realy doesn't cover
- Custom sensitivity tables (100 scenarios)
Best practice: Realy for discovery and screening → spreadsheet (or Realy detailed view) for final offer modeling.
Hybrid Workflow We Recommend
- Browse & rank on Zillow with Realy (sort by CoC)
- Customize assumptions per market (insurance, vacancy, HOA)
- Deep-dive top 3–5 in Realy.app detailed analysis
- Export to Sheets if your team requires it (optional)
- Make offers on deals that survive conservative assumptions
Stop Copy-Pasting. Start Ranking.
Related: Best Zillow Chrome extensions · How to find cash-flowing rentals